16 Personality Types Distribution & Rarity Rankings
How rare is your personality type? Explore interactive population frequency, rarity tiers, and average income comparisons between Japan and worldwide samples.
| Rank | Personality Type | Population % | Avg Income (Est.) | Avg Match | Actions |
|---|---|---|---|---|---|
| 1 | ISFJSJ Defender Caring and observant | $59,300Rank #10 | 74.3% | ||
| 2 | ESFJSJ Consul Supportive and social | $66,200Rank #6 | 74.3% | ||
| 3 | ISTJSJ Logistician Practical and reliable | $67,300Rank #5 | 74.3% | ||
| 4 | ISFPSP Adventurer Gentle and flexible | $47,200Rank #15 | 76.1% | ||
| 5 | ESTJSJ Executive Organized and direct | $76,248Rank #2 | 74.3% | ||
| 6 | ESFPSP Entertainer Outgoing and spontaneous | $58,200Rank #11 | 74.3% | ||
| 7 | ENFPNF Campaigner Enthusiastic and imaginative | $56,400Rank #12 | 74.3% | ||
| 8 | ISTPSP Virtuoso Practical and adaptable | $55,300Rank #13 | 74.3% | ||
| 9 | INFPNF Mediator Idealistic and empathetic | $45,000Rank #16 | 74.3% | ||
| 10 | ESTPSP Entrepreneur Energetic and perceptive | $69,400Rank #4 | 74.3% | ||
| 11 | INTPNT Thinker Curious and analytical | $61,200Rank #9 | 74.3% | ||
| 12 | ENTPNT Debater Inventive and energetic | $73,000Rank #3 | 74.3% | ||
| 13 | ENFJNF Protagonist Warm and inspiring | $65,100Rank #7 | 76.1% | ||
| 14 | INTJNT Architect Strategic and independent | $63,500Rank #8 | 74.3% | ||
| 15 | ENTJNT Commander Decisive and strategic | $84,434Rank #1 | 74.3% | ||
| 16 | INFJNF Advocate Insightful and principled | $54,100Rank #14 | 74.3% |
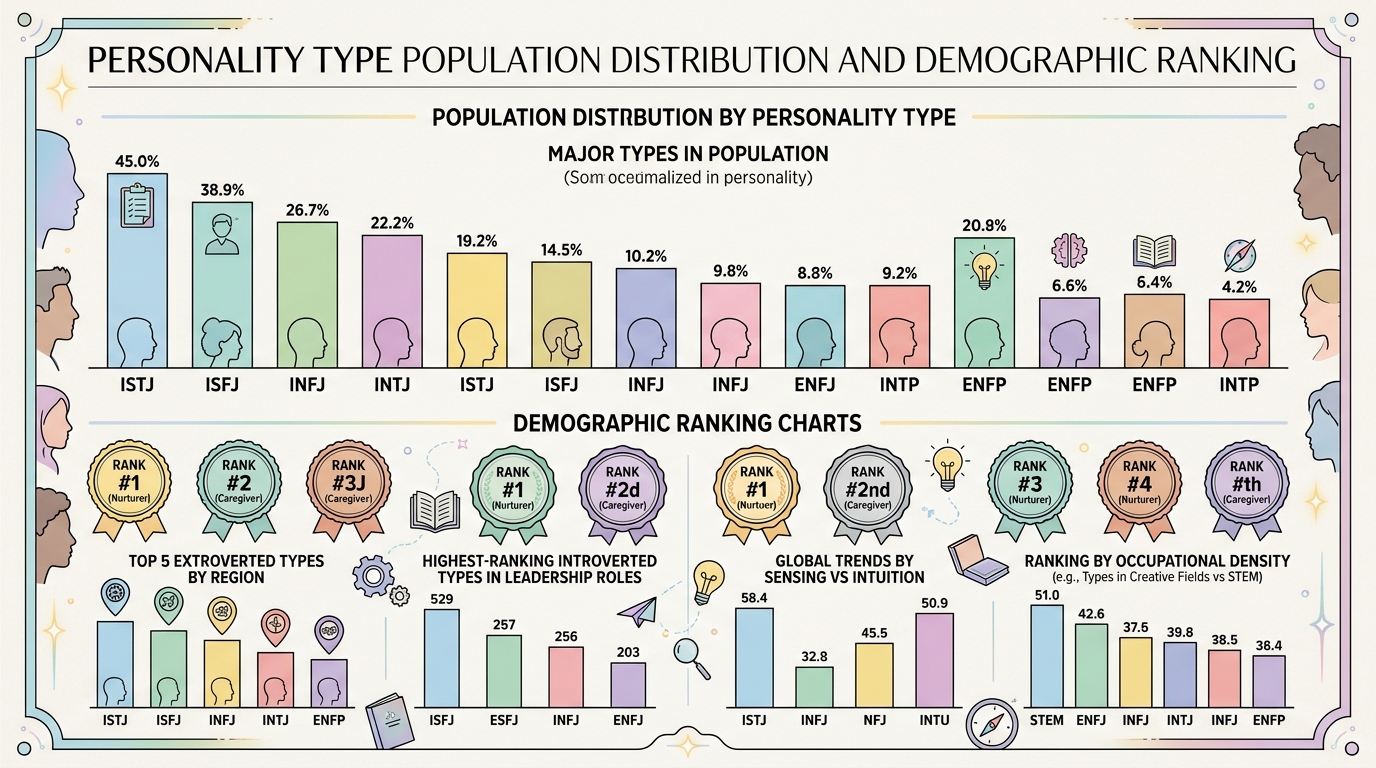
16 Personality Type Distribution & Rarity Rankings: Japan vs Worldwide Statistics
Explore why INFP/ENFP dominate Japan while ISFJ/ESFJ lead worldwide samples, plus the rarest personality types.
Read Full Distribution Analysis →Key Differences: Japan vs Global 16 Personality Distribution
In Japanese online survey samples, **INFP (Mediator: 16.44%)** and **ENFP (Campaigner: 13.79%)** represent nearly a third of all respondents. This presents a striking contrast to Western and global datasets.
Globally, Sensing-Judging types such as **ISFJ (~13.8%)**, **ESFJ (~12.0%)**, and **ISTJ (~11.6%)** form the core majority of the population (>45%). Cultural factors—such as Japan’s strong tradition of thoughtful consideration and empathetic harmony—paired with self-selection in online quiz participation help explain this unique distribution.
What is the Rarest Personality Type?
Across international research, **INFJ (Advocate: ~1.5%)**, **ENTJ (Commander: ~1.8%)**, and **INTJ (Architect: ~2.1%)** consistently rank as the rarest types in the population. In Japan, ENTJ (2.57%) and ESTP (2.62%) are among the least frequent, bringing unique strategic drive and bold adaptability to teams.
Data Sources & Statistical Methodology
Our population distribution, rarity tiers, and career metrics are synthesized from widely cited demographic research and published datasets:
Aggregated online survey sample (n>100k+) in Japan, showing elevated percentages of INFP (16.44%) and ENFP (13.79%). This reflects both cultural introspective tendencies and self-selection bias inherent to online personality testing.
International population benchmarks where Sensing-Judging types (ISFJ ~13.8%, ESFJ ~12.0%, ISTJ ~11.6%) form the largest societal demographic (>40%).
Large-scale study exploring correlations between 16 personality types and occupational earnings, illustrating higher leadership representations among Thinking-Judging types.
This site is an independent educational reference based on published typological research and is not affiliated with or endorsed by The Myers-Briggs Company or official MBTI® certifications.
Note: Statistical figures represent estimates synthesized from widely cited demographic studies (Myers-Briggs Foundation, CAPT, Truity income survey, and public online datasets). Numbers are meant for self-reflection and reference.